
So many choices!
Do you want to monitor your LLM application? Great! This is the right direction to take! Here are just a few companies doing this:

Reference: Baserun, Humanloop, Vellum, Helicone, Langfuse, Laminar, Traceloop
It feels like we’re witnessing a classic “gold rush” — but instead of hunting for gold, observability platforms are selling the “shovels” to the miners: the ML and LLM developers in need of monitoring tools.
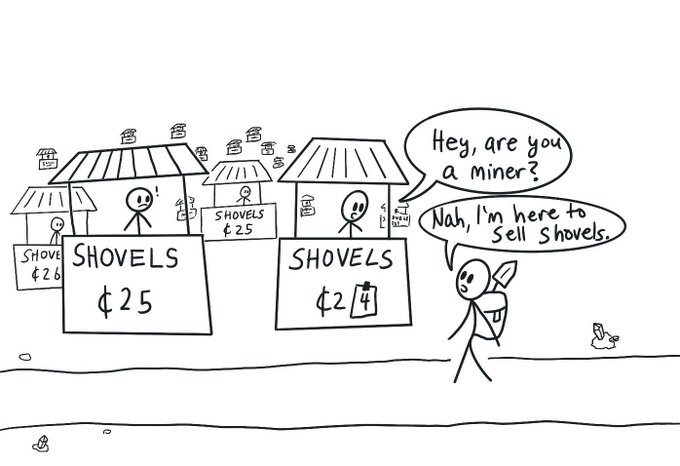
Reference: https://x.com/bwarrn/status/1813976855625826416
And I get why you’d want to sell “shovels” — successful infrastructure companies are outpacing traditional SaaS businesses.

Reference: https://www.redpoint.com/infrared/report/
But we need to decide and pick some of the “shovels.” Each platform claims some differentiation, but most focus on the same fundamental needs: logs, metrics, traces. So, how do we decide which tool is worth using?
Of course, the answer is “it depends,” but let’s break down what observability is, why it’s so crucial for ML and LLM systems, and how to sift through the endless options. This is also part of a series leading up to my course, ML in Production, where I teach teams and individuals how to build, deploy, and monitor ML systems in the real world.
Non-LLM Systems

Reference: https://www.cipher-it.co.uk/wp-content/uploads/2017/11/ITCrow.jpg
Let’s start from the basics:
The first rule of Fight Club is: you do not talk about …
Oh, sorry, it’s for a different blog post. This one is correct:
The First Rule of Machine Learning: Start without Machine Learning
from Eugene Yan and Google Rules of ML
Before diving into ML specific observability, it’s essential to recognize that most outages in production environments are not caused by ML components. Based on this amazing work, How ML Breaks: A Decade of Outages for One Large ML Pipeline, Google’s research on production systems found that the majority of issues stem from traditional software problems – bugs, infrastructure breakdowns, or misconfigured dependencies – rather than the ML models themselves.

Reference: https://www.cipher-it.co.uk/wp-content/uploads/2017/11/ITCrow.jpg

Reference: https://www.cipher-it.co.uk/wp-content/uploads/2017/11/ITCrow.jpg
Or a more recent example from Meta, The Llama 3 Herd of Models paper:

Reference: https://arxiv.org/abs/2407.21783
In other words, the reliability of an ML system depends heavily on the robustness of the non-ML infrastructure around it. Without solid observability for the underlying software, issues in ML components are difficult to detect and even harder to troubleshoot effectively.
Key Components of Traditional Observability:
- Logs: Record every event, error, and process in the system, which is essential for diagnosing where things went wrong.
- Metrics: Track system health through metrics like CPU usage, memory consumption, and latency.
- Traces: Map the journey of each request through the system, which is particularly helpful for identifying bottlenecks and errors in complex workflows.
There are so many well-established observability tools for non-ML systems, such as Datadog:

Reference: https://www.datadoghq.com/monitoring/cloud-monitoring/
Or its open-source alternative: SigNoz:

Reference: https://github.com/SigNoz/signoz
And of course, the classic Elastic Stack (ELK: Elasticsearch, Kibana & Logstash):

Reference: https://www.elastic.co/elastic-stack
and Grafana and Prometheus stack.

Reference: https://grafana.com/
Plus many more.
Each hyperscaler (AWS, GCP, Azure) has its own observability stack. Each PaaS platform has its own observability offering (Railway, for example), and so on.
If you are interested in this topic more, my recommendation is to check the OpenTelemetry project, which attempts to standardize the observability space (logs, metrics, and traces) and is supported by many vendors, such as Datadog, SigNoz, Elastic, and many more (full list here).
So, it’s time for us to move into LLM systems, but before that, some takeaways:
- Most errors come not from ML itself, so make sure you have good “observability” before moving to ML-specific observability.
- Remember the three key artifacts of observability: “Logs”, “Metrics”, “Traces”.
- Bold prediction: ML observability is not a separate category, and most of the incumbents will have ML-specific features.
LLM Systems
As monitoring non-LLM systems was not fun enough, now we have new challenges. Unlike traditional systems, ML systems are inherently dynamic, as they rely on data and models that change over time. We have all seen funny cases from Google about glue in pizza and the number of rocks you should eat per day.

Reference: https://www.forbes.com/sites/jackkelly/2024/05/31/google-ai-glue-to-pizza-viral-blunders/
And no matter what anyone says to you, completely eliminating errors or hallucinations is impossible in any ML system.
People even write papers about this, such as “LLMs Will Always Hallucinate, and We Need to Live With This”. Plus, by their nature, ML problems are ill-defined. There is very fundamental work about it: “Underspecification Presents Challenges for Credibility in Modern Machine Learning,” which is easy to understand by looking at this image:

To explain this simply, let’s say you trained three identical ML models (all numbers are made up; for actual values, check the paper itself):
- Model A: 90.32% accuracy
- Model B: 90.33% accuracy
- Model C: 90.31% accuracy
Accuracy is calculated on your standard ImageNet test set. And if you don’t care about a 0.01% change, you can call all three models equivalent, right? Right?

By using simple pixelated images in tests set and recalculating accuracy, you get:
- Model A: 94.32% accuracy on pixelated images
- Model B: 90.33% accuracy on pixelated images
- Model C: 85.31% accuracy on pixelated images
What’s the big deal? We all know about the domain adaptation problem, you might say. The issue is not the performance change, but how it changed.
Model A becomes better, Model B stays the same, and Model C becomes worse.
How is this even possible? They are supposed to be statistically equivalent models, but here we go.
Identically trained models show systematically different behavior on stress tests.
Live with it.
And you cannot catch it. You cannot check it. The only way is to put ML in production and observe. And of course, this does not happen in the moment — you need to constantly monitor and detect any drifts in your model and data: Covariate Shift, Label Shift, Concept Drift, and so on. One of the most comprehensive works on drift detection you can find here: Data Distribution Shifts and Monitoring.
Great, so I hope I convinced you of the need for ML monitoring. Could we use any lessons from non-LLM systems to do this? Absolutely! Remember, the key objects in observability are: Logs, Metrics, Traces.
- Logs: Input/Output for your LLMs.
- Metrics: Various LLM-as-a-Judge metric implementations.
- Traces: Chains on LLMs/Agent calls.
For a good LLM-as-a-Judge metric implementation, check this work: Creating a LLM-as-a-Judge That Drives Business Results. Here you go — almost the same story as normal observability, and a lot of companies are relying on existing stacks (Datadog, Elastic, SigNoz, etc.). Anything else?
Oh, yes – almost forgot – because we are all data scientists / AI engineers / etc.
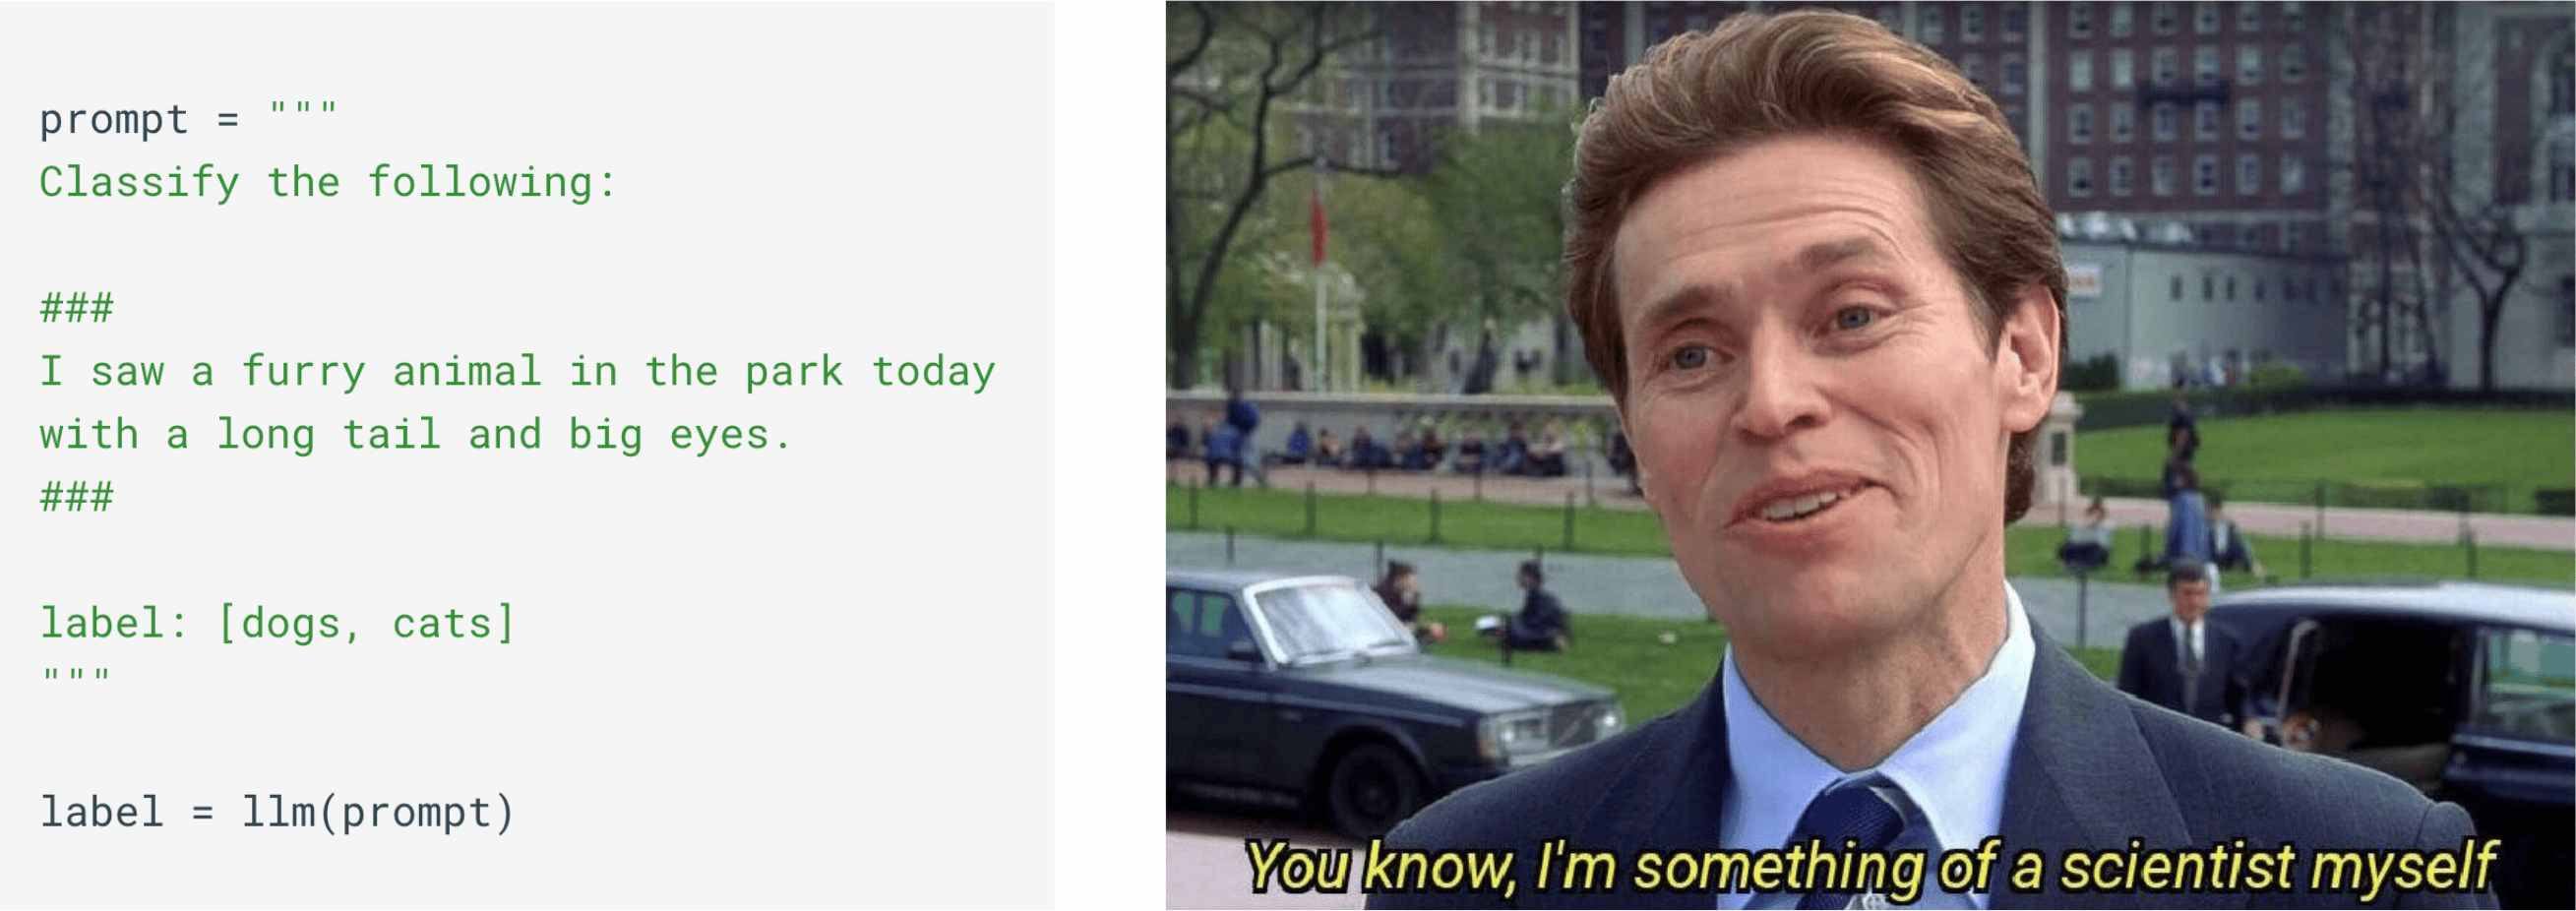
We also need to build a data moat and differentiate from the start. It’s cool to start with synthetic data (Synthesize data for AI and add feedback on the fly!), but nothing beats real one. Make sure you have this component.
Key takeaways
• ML models show systematically different behavior on stress tests — observe and evaluate in production.
• Classic Logs, Metrics, Traces are easily adaptable for LLM systems.
• Don’t forget about data moat!
Current platforms
Okay, let’s see what options are available to us as of today and add simple information for each:
- Name, GitHub, Link – Self-explanatory.
- Open Source – Is the solution open source? Not the client of SDK, but the service itself. (Yes, No)
- Managed Service – Does it have a managed version? (Yes, No)
- Incumbent – Is it part of an existing product? (Yes, No)
- Pricing – What is the pricing structure (Starts from)
- Data Moat – Does it support building data moat capabilities (Yes, No, Partially)
- Evaluation – Does it support LLM evaluation capabilities (Yes, No, Partially)
Here is my list of tools I am aware of:
Main Question: Which options should you pick for yourself? The most boring answer — it depends.
For some projects, I prefer the simplicity of LangSmith, but mostly rely on existing observability tools like Datadog with the help of Openllmetry from Traceloop. Most of the time, I use standalone open-source tools like Langfuse.
At the end of the day, the choice of tool only marginally influences the success of the product; what matters is the practice of observing and building a data moat.
Conclusion
- Before diving into LLM observability, make sure you have the fundamentals in place: clear Logs, Metrics, and Traces; the tools are secondary.
- ML and LLMs are unpredictable (hallucinations, drifts, etc.), and you cannot fix them. The only way is to observe and monitor in production.
- With the influx of tools for observability, rely on either simpler solutions or the tools you are already using for observability aka incumbent stacks.
If you want to dive deeper into these topics and learn how to build real-world ML systems, consider joining my ML in Production course (Module 7 is entirely dedicated to monitoring). You can take the course asynchronously at your own pace or join the next live cohort starting in February 15, 2025.
How do you define a ‘Data Moat’ when it comes to an observability platform? Can you give an example of a platform that wouldn’t enable a moat?
thanks for the question Matthew!
For me data moat is ability to build a trainable dataset from logs stored in the observability platform. Most platforms theoretically enable this capability, but they differ in how explicitly they support it.
– Some platforms make it very straightforward, offering features like a button or API to add logs to a dataset or annotation queue directly.
– Others require more effort, such as manually pulling data, formatting it, and using an external tool for labeling.
Platforms that do not enable this:
– Platforms that does not store actual logs.
– Platforms with log retention policies.
– Platforms that do not provide a programmatic way to extract this data.
For example https://github.com/AgentOps-AI/agentops